![]()
Introduction: Temporary but significant reductions in population size are referred to as population bottlenecks. The effects can vary depending on both the size to which the population is reduced and the duration of the bottleneck (i.e., the number of generations). Limited population size can lead to a loss of genetic variation and subsequent loss of evolutionary potential.
Importance: Loss of genetic variation has been of particular concern in captive populations, whose sizes tend to be small over many generations out of practical necessity. Populations of endangered species also tend to be small, and loss of genetic variation seriously threatens their abilities to persist and recover.
Question: How do we measure loss of genetic variation? Do the different measures yield similar estimates of the amount of variation lost?
Variables:
| H | heterozygosity |
| N | population size during bottleneck |
| n | original number of alleles |
| n' | number of alleles remaining after bottleneck |
| pj | frequency of the jth allele |
| A | allelic diversity |
| t | number of generations |
Methods: The two measures of genetic variation examined by Allendorf (1986) were heterozygosity (proportion of individuals heterozygous at a locus) and allelic diversity (the actual number of alleles present at a locus). The expected heterozygosity following a bottleneck lasting a single generation is expressed as a proportion of the original heterozygosity:
![]()
As N (the population size during the bottleneck) increases the second term (1/[2N]) decreases, and the proportion of the original heterozygosity remaining increases. In general, a bottleneck lasting one generation has a fairly small effect on heterozygosity; even if the population is reduced to 2 individuals the expected proportion of heterozygosity is 0.75 (1 - 1/[2*2] = 0.75). Calculating the expected number of alleles present at a locus is more complicated, because it depends on the number and frequencies of alleles present before the bottleneck. For a diploid locus with n alleles, the frequency of the jth allele is expressed as pj (for our purposes we will assume that the alleles are equally frequent; if n = 4 then the frequency of each allele will be 0.25). The number of alleles we would expect following a bottleneck (n') is calculated by the following equation:
![]()
For each of the n alleles, we subtract the frequency of that allele from 1 and raise the difference to the bottleneck population size (N) multiplied by 2. These values are summed for all n alleles, and the sum is subtracted from the original number of alleles (n). We can then use this number (n') to calculate the allelic diversity (A) after a bottleneck. A is the ratio between [the remaining number of alleles minus one] and [the original number of alleles minus one]:
![]()
When all alleles are retained, A = 1. If only a single allele remains, A = 0. The graph below (redrawn from Allendorf, 1986) illustrates the relationship between allelic diversity remaining after a single-generation bottleneck and the original number of alleles for different population sizes. The black dots indicate the expected proportion of heterozygosity remaining for each population size.
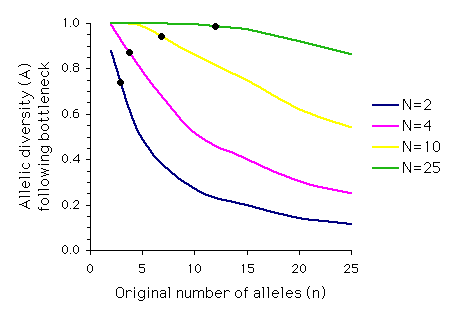
Note that although the proportion of heterozygosity retained for a bottleneck of N = 2 is 0.75, the proportion of allelic diversity retained when five or more equally frequent alleles are present before the bottleneck is less than 0.50.
Another consideration is the duration of the bottleneck. For how many generations is the population size reduced? How does this affect heterozygosity and allelic diversity? We can calculate the expected proportion of heterozygosity retained after a bottleneck with population size N lasting for t generations:
![]()
Allendorf used computer simulations to examine the effect of multiple generations on allelic diversity. For each set of parameter values (N, n and t) the simulation was run 1,000 times, and the means of these simulations are graphed below. Each graph represents a different population size, N, with t on the x-axis and A on the y-axis. The different colored lines represent different numbers of alleles present (n) prior to the bottleneck (n = 2, 5, or 10). The dashed line represents the expected loss of heterozygosity (E(H)) for a population of size N over t generations. (Graphs redrawn from Allendorf 1986; values for A estimated from same).
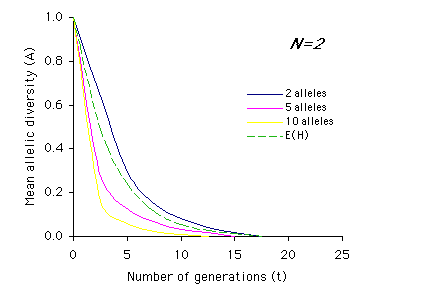
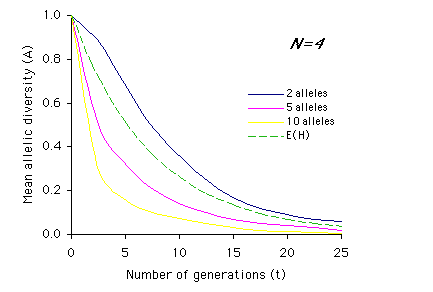
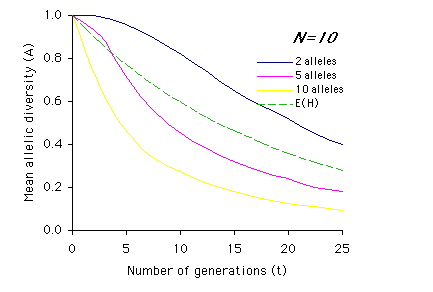
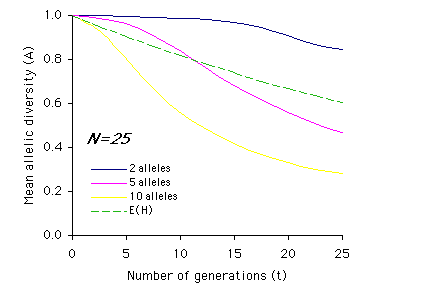
Interpretation: As you can see from the above graphs, in most cases (with the exception of two equally frequent alleles originally present) the expected proportions of heterozygosity remaining (E(H)) indicate a higher retention of genetic variation than measured by allelic diversity (A). It is also apparent that the effects of bottlenecks on genetic variation are greatly increased as population size (N) decreases, and that the duration of the bottleneck (t) compounds these effects.
Conclusions: Heterozygosity can be used as a measure of a population's capacity to respond to selection immediately after a bottleneck. Allelic diversity, on the other hand, determines a population's ability to respond to long-term selection over many generations, and ultimately the survival of the population (perhaps even of the species). The models presented here assume random mating, and does not take into account effective population size (the number of breeding individuals in a population, which is generally smaller than the total number of individuals; see EFFECTIVE POPULATION SIZE). However, it is clear that different measures will lead to different predictions about the amount of genetic variation retained in a population following a bottleneck.
Additional Questions:
1) Calculate the proportion of original heterozygosity remaining after 1 generation and after 10 generations for populations where N = 2, 4, 10, 25, 50, and 100. How do population size and duration of bottlenecks affect loss of heterozygosity?
2) Using the graphs of A by t, describe how the relationship between heterozygosity (dashed line) and allelic diversity (A) changes over time based on population size (N) and initial number of alleles (n). For example, for N=2 and n=2, the mean allelic diversity and the expected heterozygosity (E(H)) decline at similar rates, whereas the mean allelic diversity when n=5 or n=10 drops off much more sharply than heterozygosity.
Extra Credit) Calculate allelic diversity (A) for the same population sizes as in question (1) for populations starting with 5 alleles and populations starting with 20 alleles. How do population size and original number of alleles affect loss of allelic diversity?
Sources: Allendorf, F. W. 1986. Genetic drift and the loss of alleles versus heterozygosity. Zoo Biology 5:181-190.
Futuyma, D. J. 1986. Evolutionary Biology, 2nd ed. Sinauer Associates, Inc. Sunderland, MA.
copyright 1999 by M. Beals, L. Gross, and S. Harrell