CARDIAC OUTPUT
Introduction: Vertebrate circulatory systems consist of blood, which transports materials to and from cells via blood vessels, and a heart to pump the blood. One important role of the circulatory system is to provide oxygen to cells. As a general rule, small animals have a higher rate of oxygen consumption per unit body mass than large animals. Therefore, the heart of a small animal must supply oxygen at a higher rate than the heart of a large animal. Since the oxygen capacity of blood is similar between small and large animals, small animals must have hearts that pump blood at a higher rate, or in other words, have a higher cardiac output.
Importance: We can use a mathematical model to quantify the cardiac output of an individual’s heart. By comparing this equation to data, we can determine methods organisms may use to increase their cardiac output.
Question: How do changes in stroke volume and heartbeat frequency affect cardiac output?
Variables:
|
VO2 |
volume of oxygen consumed (mL/min) |
|
Q |
cardiac output (mL/min) |
|
Ca |
oxygen content in arterial blood (mL O2/mL blood) |
|
Cv |
oxygen content in venous blood (mL O2/mL blood) |
|
f |
heartbeat frequency (min-1) |
|
S |
stroke volume (mL) |
Methods: Cardiac output can be estimated in mammals and birds from Fick's principle. Fick’s principle states that the rate of diffusion is proportional to the difference in concentration. Similarly, the volume of oxygen consumed per unit time is proportional to the difference in oxygen content between arterial and venous blood. The degree of proportionality depends on the volume of blood pumped per unit time, or cardiac output (Q). Therefore, cardiac output (Q) can be calculated from the equation
VO2 = Q(Ca -Cv)
where VO2 is the volume of oxygen consumed per unit time, Ca and Cv are the arterial and venous oxygen concentrations. Experimentally, the volume of oxygen consumed and oxygen concentration in the blood can be calculated. We can then solve for cardiac output (Q). Unfortunately, using Fick’s principle requires can be misleading in animals where arterial and venous blood may mix, such as reptiles and amphibians, or in animals that uptake a considerable amount of oxygen through their skin.
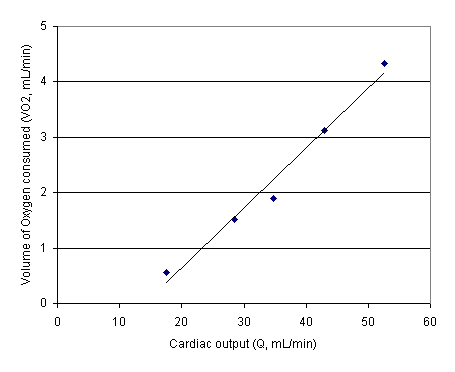
Kiceniuk and Jones (1977) collected data for trout on volume of oxygen consumed (VO2) and cardiac output (Q) at different levels of activity. When VO2 is plotted as a function of Q, we do indeed get a line where the slope is given by approximately Ca –Cv. In reality, Ca-Cv changes slightly as activity increases.
Cardiac output is the volume of blood pumped by the heart per unit time and depends on the heartbeat frequency as well as the volume of blood ejected in one contraction. We can therefore write the following equation:
Q = f x S
where f is the heartbeat frequency and S is the volume of blood ejected in one contraction, or the stroke volume.
Notice an animal may increase its cardiac output by increasing its heartbeat frequency or the stroke volume. By comparing a pigeon and a trout, we can determine methods animals use to increase their cardiac output, as well as the volume of oxygen consumed.
|
|
|
Rest |
Active |
Increase |
|
Pigeon |
f |
115 beats/min |
670 beats/min |
5.8 x |
|
|
S |
1.7 mL |
1.59 mL |
0.9 x |
|
|
Q |
195.5 mL/min |
1065 mL/min |
5.4 x |
|
|
VO2 |
20.3 mL/min |
200 mL/min |
10 x |
|
Trout |
f |
37.8 beats/min |
51.4 beats/min |
1.36 x |
|
|
S |
0.46 mL |
1.03 mL |
2.24 x |
|
|
Q |
17.4 mL/min |
52.9 mL/min |
3.04 x |
|
|
VO2 |
0.56 mL/min |
4.3 mL/min |
7.7 x |
Interpretation: For both trout and pigeon, activity results in an increase in oxygen demand. Volume of oxygen consumed (VO2) is increased by increasing the cardiac output of the heart (Q). However, trout and fish do this in different ways. An active pigeon primarily increases cardiac output through an increased heart rate (f) in order to meet the demand for oxygen (increases almost 6 fold). Stroke volume actually decreased in the active pigeon. In contrast, a swimming fish increases cardiac output by primarily increasing stroke volume (more than doubling S) with only a small increase in heart rate (only a 30% increase).
Conclusions: We can quantify the cardiac output of the heart by measuring heart beat frequency, stroke volume, and oxygen concentration in the blood. Organisms can improve their oxygen consumption by manipulating functions that increase their cardiac output.
Additional Questions:
1. Look at the equation for volume of oxygen consumed (V) derived from Fick’s principle. During activity, oxygen consumption increases. According to the equation, what are three ways to accomplish this and what do they mean biologically?
2. During activity, more oxygen is taken from the venous blood before it returns to the heart. How would this affect the value of Cv? Calculate the difference in oxygen concentration between arterial and venous blood (Ca – Cv)for the pigeon and trout under resting and active conditions. Do your calculations make sense biologically?
Sources: Schmidt-Nielsen, K. 1990. Animal Physiology: Adaptation and Environment. Cambridge University Press, Cambridge.
Butler, P. J., N. H. West, and D. R. Jones. 1977. Respiratory and cardiovascular responses of the pigeon to sustained, level flight in a wind tunnel. Journal of Experimental Biology 71:7-26
Kiceniuk, J. W. and D. R. Jones. 1977. The oxygen transport system in trout (Salmo gairdneri) during sustained exercise. Journal of Experimental Biology 69:247-260.
Copyright 1999 M. Beals, L. Gross, S. Harrell