PHOTOTROPISM AND GRAVITROPISM: QUANTIFYING CURVATURE IN PLANTS
Introduction: Plants adjust to the conditions of their environment through growth responses. For example, plant stems generally bend toward light sources while roots grow away from light sources. This process is called phototropism. Substances called auxins play a strong role in controlling various plant responses. Auxin increases the plasticity of plant cell walls causing them to stretch more during active plant growth. During phototropism, the auxin concentration in stem cells is usually higher on the side of the stem away from light. These cells will stretch more during active growth, causing the plant to move toward the light source. In gravitropism, plants respond to gravity, generally causing shoots to grow up and roots to grow down.
Importance: In order for scientists to study plant responses to light and gravity, they must be able to quantify the degree of plant curvature. In order to make accurate assessments of plant growth, changes in plant curvature should be distinguished from changes in plant length or weight. We can use principles of geometry to measure plant curvature.
Question: How is plant curvature measured? How does curvature change over time in response to gravity or a light source?
Variables:
|
R |
radius of curvature |
|
k |
curvature |
|
da |
change in stem angle |
|
dL |
change in stem length |
|
p |
circle perimeter |
|
f |
fraction of circle perimeter covered by stem curvature |
Methods: The first step in measuring plant curvature is to make diagrams, or take photographs or videos of the plants under observation. We can use principles of geometry and trigonometry to quantify curvature at any point along the length of a plant.

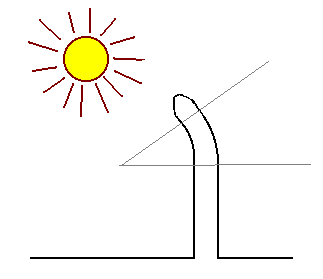
We start by choosing two points along the curve. We will examine the length of the stem between these two points. This is illustrated in the above diagram by the grey wedge. We will examine the outside curve of the stem, the side that is away from the light.
One simple way to quantify curvature is to measure R, the radius of curvature. A circle is placed over region under examination so that the circle just fits the curve at a given point. The radius of this circle is the radius of curvature.
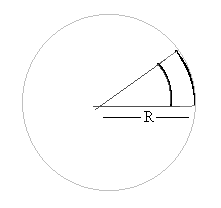
An alternative way to quantify curvature is to measure the relative change in stem angle per change in stem length.
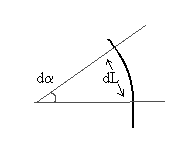
We first visualize draw perpendicular lines from each of the two points we have chosen along the curve. The place where these two lines intersect gives us the change in angle, da, due to curvature. We must also measure the change in stem length from the first to second point along the stem curvature. This is given by dL. Thus, we measure curvature (k) as
k = da / dL
where k is the change in stem angle per change in stem length.
The radius of curvature, R, and curvature, k, are related to one another. Notice that dL is just the arc of a circle of radius R. The entire perimeter (p) of this circle would be given by
p = 2pR.
However, the arc takes up only a fraction of the circle's perimeter. The angle of the arc is given by da. An entire circle, however, is 360° or 2p in radians. Hence, the fraction (f) of the circle occupied by the curve dL is given by
f = da / 2p .
Therefore we can calculate dL as a fraction of the perimeter:
dL = fp = (da / 2p) (2pR).
By cancelling and rearranging, we find that
da / dL = 1/R or k = 1/R
Therefore curvature, k, is the reciprocal of the radius of curvature, R.
Interpretation: Scientists can take time-lapse photographs of plant stems or roots in order to quantify curvature over time, and under different treatments. For example, many seedlings are characterized by a hook shape at the terminal portion of the shoot apex. This hook helps the seedling push through the ground and protects the apical meristem. When the hook is exposed to light, it begins to straighten.
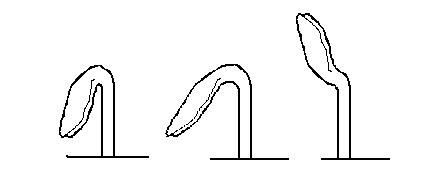
We can quantify curvature along the length of the stem at different stages in time (2, 12, and 28 hours after being exposed to light) and plot it as a series of graphs (taken from Silk and Erickson 1978).
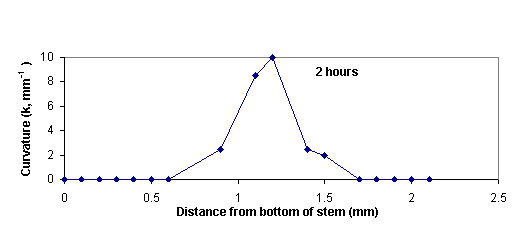
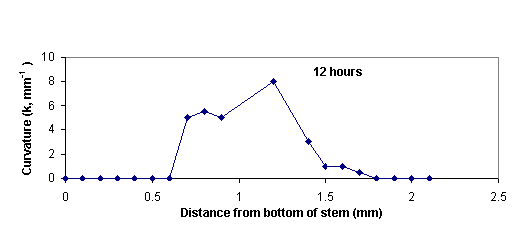
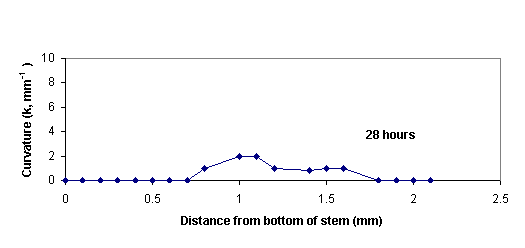
After two hours exposure to light, the stem has a very sharp hook. Over time, the hook straightens, and the degree of curvature along the length of the stem gradually decreases.
Conclusions: Phototropic and gravitropic responses in plants can result in changes in the curvature of stems and roots. Principles of geometry can be used to quantify the degree of curvature and monitor changes over time or across treatments. Quantifying curvature is also the first step in modelling changes in curvature over time.
Additional Questions:
1. Look at the graphs of curvature (k) versus distance from stem base for seedling development. Develop similar graphs for the radius of curvature, R, versus distance from stem bottom for seedling development at 2, 12, and 28 hours.
Sources:
Meskauskas, A., D. Moore, and L. N. Frazer. 1998. Mathematical modelling of morphogenesis in fungi: spatial organization of the gravitropic response in the mushroom stem of Coprinus cinereus. New Phytologist 140:111-123
Silk, W. K. 1989. On the curving and twining of stems. Environmental and Experimental Botany 29:95-109.
Silk, W. K. and R. O. Erickson. 1978. Kinematics of hypocotyl curvature. American Journal of Botany 65:310-319.
Copyright 2000 M. Beals, L. Gross, S. Harrell