DOUBLING TIME OF TUMORS
Introduction: The cell cycle is divided into four stages: Gap 1, DNA synthesis or S-phase, Gap 2, and mitosis. When modelling the growth of a population of cells, it is commonly useful to assume that every individual cell doubles with every cell cycle, i.e. the daughter cells themselves divide upon completion of the next cell cycle. This is typically expressed as an exponentially growing population (see Cell Division in the Presence of a Growth Factor and Cell Division). However, in many circumstances, not all the daughter cells divide, and the rate of population growth can be affected. For example, tumor growth rate is less than that of normal cells due to the considerable loss of cells and the fact that only a fraction of the cancerous cells are dividing.
Importance: Being able to quantify aspects of the cell cycle is important for measuring the growth of tumors under different treatments.
Question: Can quantitative techniques be used to more conveniently predict the doubling time of tumors?
Variables:
|
D |
doubling time of cells (hours) |
|
S |
length of DNA synthesis (hours) |
|
F |
fraction of cells dividing |
|
c |
correction factor |
|
Fs |
florescence of cells in S-phase |
|
Fg |
florescence of cells in G1-phase |
|
Fm |
florescence of cells in G2 phase |
Methods: The potential doubling time (D) of cancerous cells can be calculated as
![]()
where S is the length of DNA synthesis or S-phase, F is the fraction of dividing cells, and c is a correction factor. If F=1 then the doubling time of cells is approximately equal to the doubling of DNA synthesis.
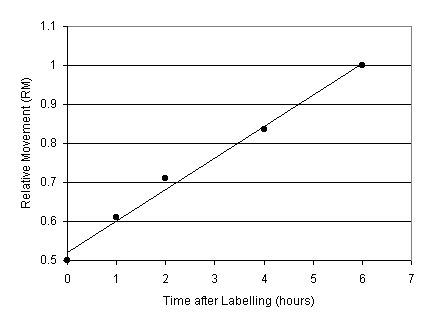
A growing population of cells can be quantified using florescence techniques. The relative movement (RM) of cells through the S-phase can be calculated by measuring the DNA content of cells with florescence techniqes. RM is initially around 0.5 as the florescence pattern of S phase cells is approximately half way between that of G1 and G2 cells. RM is estimated by

where Fs, Fg, and Fm are the florescences of cells initially in S-phase, in G1, and in G2 or mitosis. We can plot RM over time from experimental data.

Interpretation: RM approximately increases linearly with time to a value of 1.0 as cells in S-phase reach G2. In otherwords, the DNA content of S-phase cells (Fs) approaches the DNA content of cells in G2 (Fm). For example, assuming RM is initially 0.5, if RM is 0.75 after 3 hours, then it should reach 1.0 after 6 hours. Hence the time for DNA synthesis (S) is 6 hours.
It is possible to estimate DNA synthesis without the RM florescence experiment running to completion. In general,
![]()
where t is the amount of time to reach a particular RM. Notice if RM = 1, then S=t, or S is simply the amount of time for RM to reach 1.0. Since this equation increases linearly over time, it is possible to estimate S after only a short period of time.
The DNA synthesis time (S) can be quickly estimated for samples taken from cancer patients, without waiting for the cell population to actually double. The DNA synthesis time (S) can then be substituted into the original equation to determine the potential doubling time (D) of the tumor.
Conclusions: Quantifying properties of the cell cycle allows us to quickly estimate doubling time of cells. This is particularly important for estimating the doubling time of tumors in cancer patients.
Additional Questions:
1. Tumorous cells are taken from a cancer patient. A lab assistant finds that 1/3 of the tumorous cells are actually dividing. Florescence techniques show that after 1 hour, RM = 0.55. Calculate the potential doubling time for this patientís tumor.
Source: Begg, A. C., N. J. McNally, D. C. Shrieve, and H. Karcher. 1985. A method to measure the duration of DNA synthesis and the potential doubling time from a single sample. Cytometry 6:620-626.
Copyright 1999 M. Beals, L. Gross, S. Harrell