RHYTHMS IN BREATHING AND LUNG CAPACITY
Introduction: The respiratory system functions to filter, warm, and humidify the air we breathe, and to supply cells with oxygen while removing carbon dioxide. In animals that breathe with lungs, air moves into the lungs through the trachea and then back out again. When each breath is completed, the lung still contains a volume of air, called the residual volume. Each inhalation adds additional air. Each exhalation removes approximately the same volume as was inhaled.
Importance: Normal breathing involves rhythmic inhaling and exhaling. Therefore, we can quantify breathing using trigonometric equations. Changes in breathing, such as those due to increased activity, can then be measured.
Questions: How does lung capacity change over time? How does activity affect lung capacity?
Variables:
|
y |
property exhibiting a rhythm (lung capacity) |
|
t |
time |
|
A |
amplitude |
|
p |
period |
|
sy |
phase shift in height of y |
Methods: An apparatus called a spirometer is used to measure the volume of air inhaled and exhaled while breathing. A spirogram is the record of the changing volumes over time. The output of a spirogram can be quantified using trigonometric equations.
In general, we can describe any repeating rhythm by a sine wave:

where y is some property that exhibits a rhythm, t is time, A is the amplitude, p is the period, and sy is a phase shift in the height of y compared to the simplest sine wave (y = sin t where sy=0). sy can be thought of as the value of y half way between the peak and crest of the wave. The amplitude of a wave is the height from peak to crest. For the simplest sine wave, y = sin t, the amplitude is 2. The period of a wave is the time for completion of one cycle. For y = sin t, the period is 2p.

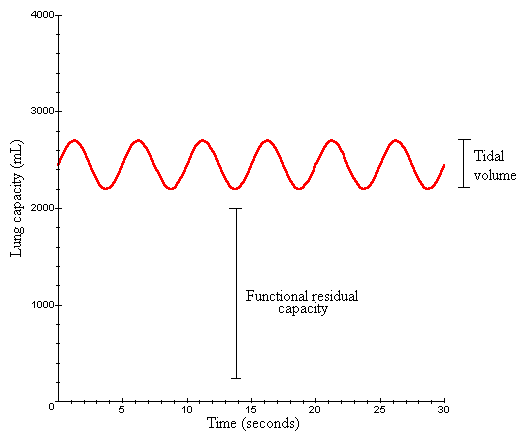
In humans, when each breath is completed, the lung still contains a volume of air, called the functional residual capacity (approximately 2200 mL in humans). Each inhalation adds from 500 mL of additional air for normal (resting) breathing. Each exhalation removes approximately the same volume as was inhaled. The volume of air inhaled and exhaled normally is called the tidal volume. It takes approximately 5 seconds to complete a single cycle. With this information, we can develop an equation for lung capacity as a function of time for normal (resting) breathing. Since sy describes the midpoint of the sine wave, we take the functional residual capacity plus 1/2 the amplitude to give us sy=2200+250=2450 mL. Our period is the the time for a single cycle, or p=5 seconds. The volume of air inhaled gives the amplitude, or A=1000 mL. We therefore have the following equation for normal breathing:

which we can graph.

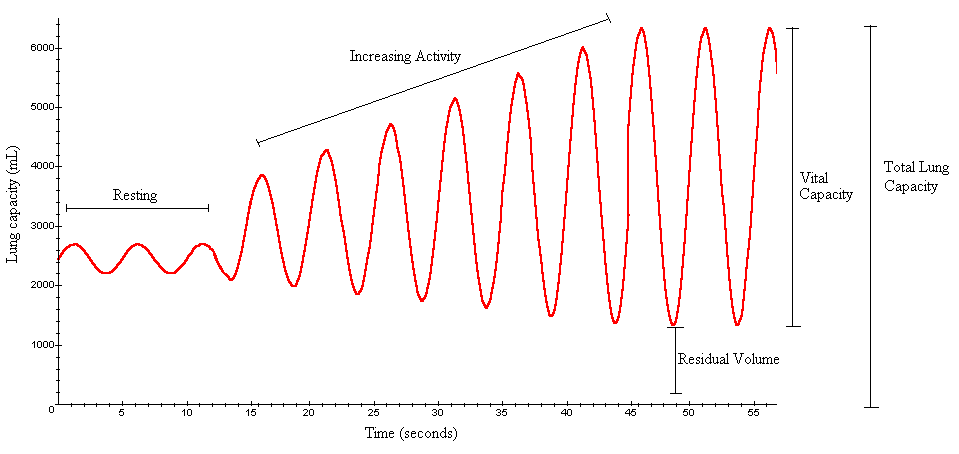
As the degree of activity increases, the volume inhaled and exhaled increases from 500 up to 3000 and the functional residual volume decreases as greater amounts of air are exhaled. In our equation for lung capacity, this is reflected as an increase in amplitude (A) and a decrease in functional residual capacity.

Interpretation: As activity increases, a greater amount of air is forced in and out of the lungs. As a result, the reserve volume in the lungs decreases. However, the lungs have a limited total capacity of 5700-6200 mL. When inhalation and exhalation are at their maximum, the vital lung capacity is reached (approximately 4500-5000 mL). There is a residual volume remaining in the lungs (approximately 1200 mL), even with maximum exhalation, that cannot be forcibly expired.
Conclusions: We can use trigonometric equations to quantify changes in lung capacity over time. Quantifying lung capacity in the form of spirograms is useful for diagnosing illnesses or respiratory problems. Also, patterns in breathing are likely to differ among different groups of people and under differing circumstances.
Additional Questions:
1. Determine an equation for lung capacity as a function of time when breathing is forced at maximum and minimum exhalation. Assume the vital capacity is 4000 in order to determine amplitude. Assume the residual lung capacity is 1200 mL to determine sy. Assume a single breathing cycle is completed every 5 seconds.
2. During hyperventilation, breathing is very rapid with deep inhalations and exhalations. How would you modify the sine equation for lung capacity over time to reflect hyperventilation? How would a graph of hyperventilation compare to normal breathing?
3. Emphysema reduces the flexibility of alveolar walls in the lungs so that they are unable to recoil normally from expiration. This results in an increased residual volume. How would a spirogram of a person with emphysema compare to that of a healthy person, assuming the same total lung capacity? How would emphysema affect the vital capacity?
Sources: Berne, R. M. and M. N. Levy (editors). 1998. Physiology, 4th edition. Mosby, Inc. St. Louis, MO.
Thibodeau, G. A. and K. T. Patton. 1996. Anatomy and Physiology, 3rd edition. Mosby, Inc. St. Louis, MO.
Copyright 2000 M. Beals, L. Gross, S. Harrell